


One of the benefits (sometimes welcomed, sometimes not) of organizations adopting agile methodologies is the unraveling of organizational dysfunction. Typically, this happens pretty quickly and is a natural consequence of adopting a way of working that emphasizes team empowerment, empirical data as the engine for decision-making, and more transparency than feels comfortable. For organizations interested in improving and building a sustainable, positive culture, this is good news. Unfortunately, in many places, old habits are hard to break. Command-and-control, mistrust, blame, and other toxic culture-killers are not always easy to change, especially if they have become deeply engrained in the way teams and companies operate and treat each other. You may not be aware that one of the best diagnostic tools to uncover this type of dysfunction is right at your fingertips: the burndown chart.
What burndown charts represent
The following is what a realistic burndown chart may look like: 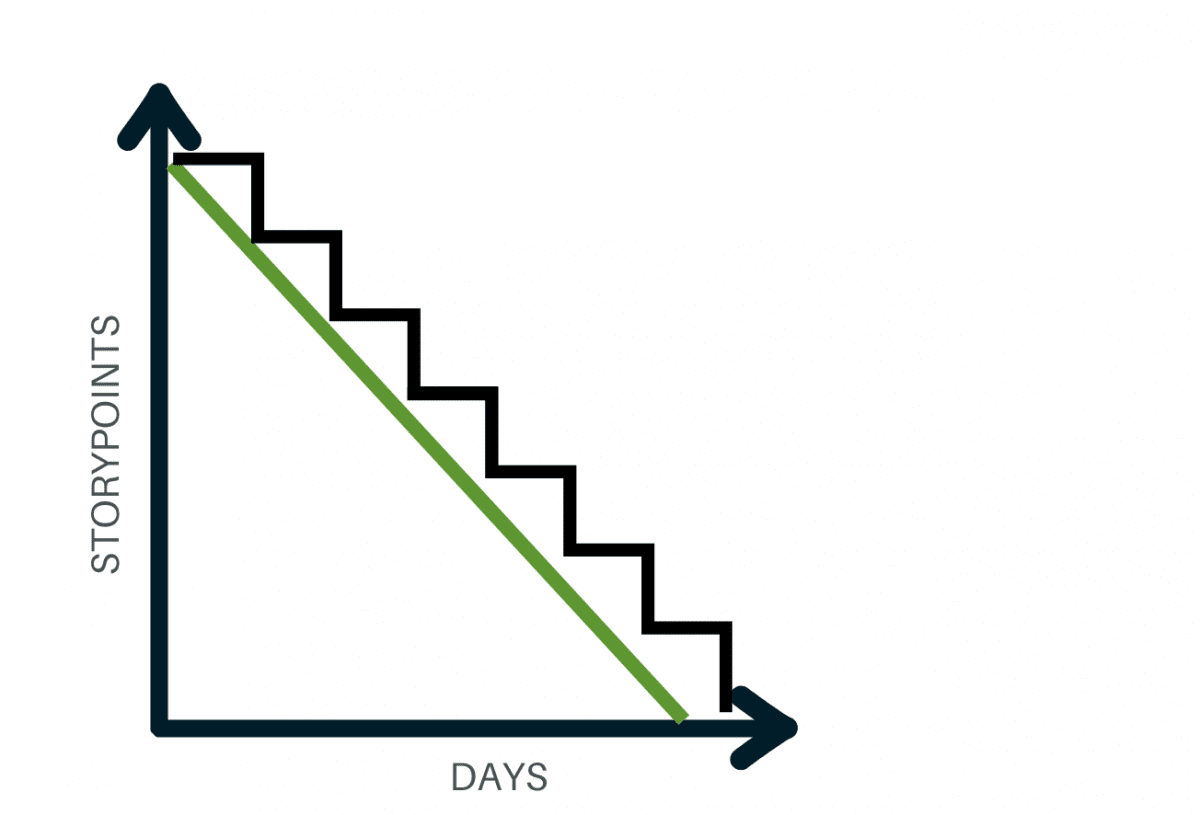 In the burndown chart above, the green line represents the ideal burn rate of story points over the duration of the sprint, or iteration. In other words, the green line is what a team’s burn rate or completion of story points would look like if the same number of user stories were completed every day over the life of a sprint. The dark blue line, on the other hand, represents a more realistic view of a team’s work: stories within a sprint are not equally sized and require different amounts of effort to be completed. Since a user story is only complete once all the tasks related to it are, some stories will require more days than others to reach completion, therefore causing the line to zigzag. One of the best ways to diagnose a culture of mistrust is when teams are consistently producing charts that look like this:
 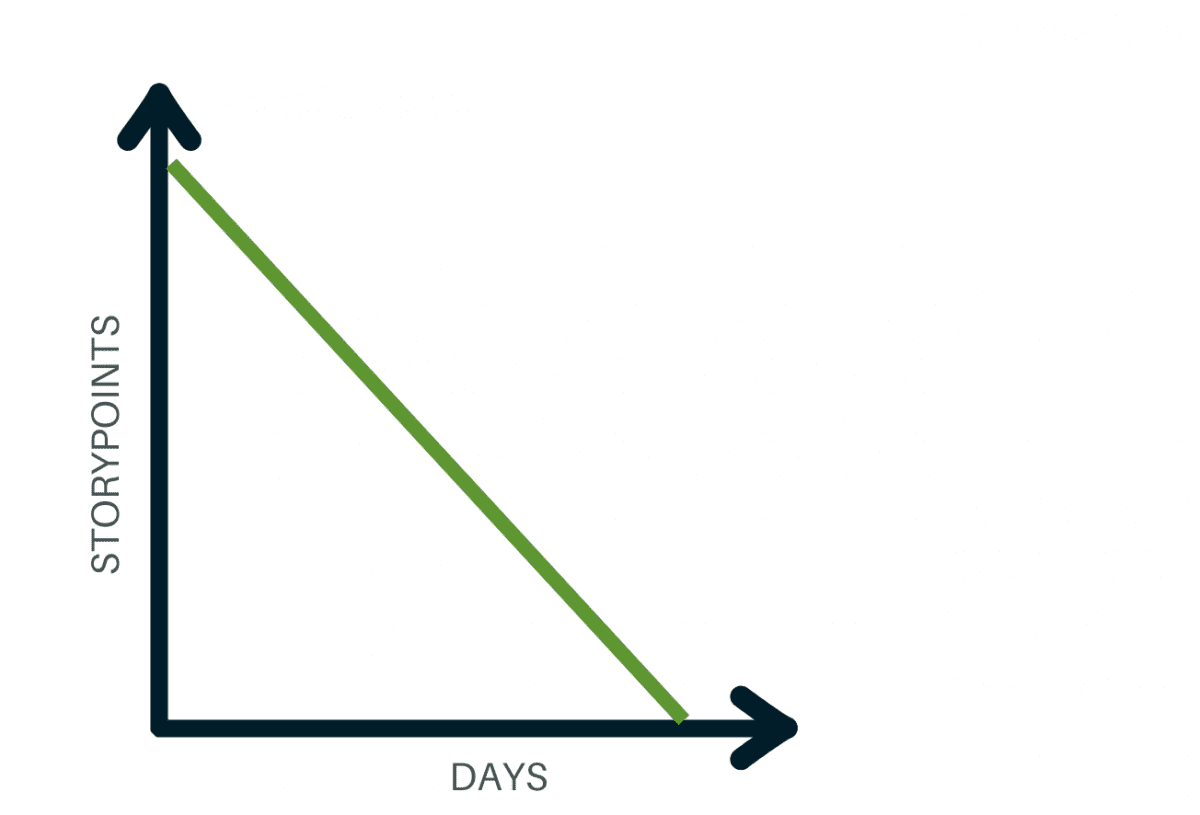 Although it’s not impossible for a sprint to have a burndown chart that follows the ideal burndown line, it is probably a rare exception (and a red flag). When a team consistently produces burndown charts that look “perfect,” you can be close to 100% sure that this is an artificial representation of their actual burn rate, and that there is something else going on.
Reconginizng the “perfect” burndown chart
As humans, we are comforted when things are going according to plan, which can lead to ignoring the telltale signs of trouble in favor of reporting on-time delivery. Learn to recognize the “perfect” burndown chart as a sign of trouble and an opportunity to find out why your team is misrepresenting their burn rate. Even if all the committed work is complete as promised by the end of the sprint, you’re losing context regarding when something may have taken longer than expected, what work may have been rushed in order to catch up, or other information that is embedded within your team’s burndown chart. Looking for a tool to expose progress of your releases and sprints? Download our free Excel product backlog and sprint backlog template and start enjoying the transparency.