


Earlier in my career, I participated in and eventually led projects using traditional project management techniques (waterfall), a defined process control. The team spent a significant amount of time at the beginning building a plan. We believe if we planned well, the likelihood of our success increased. When leaders ask about our forecasts’ certainty, we based the confidence of it on our detailed planning. Our mantra was, “Plan the work, then work the plan.” Unfortunately, we made this forecast and commitment when we knew the very least about the product, our customers’ needs, or the actual work.
Shifting to the agile framework
Years later, I found agile values, principles, and techniques. I learned that agile approaches, such as scrum, use empirical process controls. Empirical process controls are verifiable by observation or experience rather than theory. The three pillars of empiricism are transparency, inspection, and adaptation. Empiricism is most valuable when the outcomes are unknown, innovation is a requirement, and the work is complex. It’s an exposure model and describes most product or service work delivered by today’s teams. As the following diagram depicts, defined process controls are useful when the solution is known, the steps are clear, and the problem is simple (left side). Empirical process controls are helpful when there is uncertainty, innovation is necessary, and the problem is complex (right side).  How can an agile product development team, given the uncertainty and complexity of their work, forecast the accomplishment of a product or release goal? The key is to harness empiricism to your advantage.
Begin with relative estimation
Relative estimation is a technique teams use to estimate the size of similar work quickly. They relatively compare one piece of work to another, valuing accuracy over precision. In other words, they appreciate being accurate in grouping work into similar sizes over being precise in estimating the differences. For example, when reviewing a backlog of product development ideas, such as user stories, they can see which stories in the backlog are similar in effort, risk, complexity, etc. However, they will struggle to say exactly by how much effort in hours (precision). Story pointing usually uses the Fibonacci scale, named after the 11th-century Italian mathematician (1, 2, 3, 5, 8, 13, etc.). Story points are a unit of measure for expressing an estimate of the overall effort (paradoxically not about time) required to fully implement a product backlog item or any other piece of work. We use the term story point because teams can place a relative point estimate on the user story using Planning Poker or Affinity Estimating techniques. When the team finishes the sprint, they add up all the story points for the completed backlog items and call it the team “velocity.” Velocity allows teams to evaluate how much to pull into the next sprint. They use factual, historical data, similar to patterns of weather, “If yesterday’s weather was sunny, today’s weather will be similar,” accounting for any capacity variances, such as vacations or holidays. For example, during sprint planning, the development team may say, “Last sprint, we completed 12 points of work (velocity), which was challenging. All things being equal and based on the improvement idea we had from our retrospective, we should be able to pull in at least 12 points again. Maybe even 13.” Estimating the size of a backlog allows teams to predict or extrapolate the accomplishment of their goals. Forecasting without a known velocity is not empiricism. It’s like asking how long a trip will take, not knowing if we’ll be using a horse or a sports car. Using the story point as the foundation, let’s review three alternatives for empirical process control forecasting: PERT, burndown, and fixed date/fixed scope forecasting.
PERT
The first forecasting method is PERT (Program Evaluation Review Technique). PERT charts are traditional project management tools used to plan tasks within a project, making it easier to schedule and coordinate the work. PERT charts, created in the 1950s, help manage the creation of weapons and defense projects for the U.S. Navy. With PERT, teams develop three different time estimates for the project:
- The shortest possible amount of time each task will take.
- The most probable amount of time.
- The longest amount of time tasks might take if things don’t go as planned.
PERT calculations are backward from a fixed end date since contractor deadlines typically aren’t flexible. PERT charts define a range of probable delivery. However, a fundamental weakness of PERT is that the basis is hypothetical hours. With agile techniques, using the PERT theory, a forecast is easy to calculate and is NOT hypothetical. After only a few short sprints, teams can extrapolate the high, low, and average velocities based on real, actual data. You can draw simple lines overlaying cumulative point sums in the product backlog to show which features are likely, probable, and unlikely by multiplying the three numbers by the remaining number of sprints. The forecast is no longer based on hope but factual, proven data. I’ll discuss an example of how empirical PERT can be used with a fixed scope forecast later.
Burndowns
Burndown charts, the second method, are also helpful for forecasting release schedules. After each sprint or day, if using a sprint burndown, teams can compare their burndown’s reality against a planned forecast. As the team works sprint after sprint, underages and overages appear, allowing the team to reevaluate and adapt every sprint. If new requirements arise, the backlog is adjustable to accommodate the new scope, or even more likely; they can decide which scope to swap or remove to maintain the projection. Burndowns are also useful when multiple teams are working toward the same release goal. Another advantage is that after a single sprint, the team will know if they are on or off track for reaching their goal. 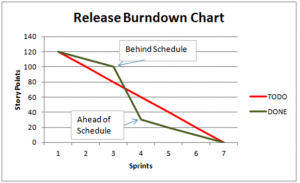 Teams appreciate using burndowns for forecasting because they:
- Are easy to create and interpret. Seeing the green line above or below the red line on any given day (or sprint) is as simple as it gets creating real-time intelligence.
- Allow teams to ask questions and have meaningful discussions based on the reality of their situation.
- Enable agile leaders to manage by exception. As leaders peruse the various burndown charts of the teams within their organization, they can quickly focus on the teams needing the most help (situations where the green line is above the red line).
Fixed date/scope forecasting
The third model, explained by Henrik Kniberg in the YouTube video Product Ownership in a Nutshell, is fixed date and scope forecasting using empirical PERT forecasting. Product owners find these helpful for sharing and adjusting forecasts with their stakeholders and the larger organization. Henrik shows how a typical team can track their velocity over time by plotting their actual velocity on a graph. From those points, teams can extrapolate trend lines into the future. If the team has a fixed date for their release, they can forecast the level of features included in the release based on their actual velocity. For example, let’s say we have a team with a 250-point backlog using weekly sprints and a velocity history of:
- High = 13 points
- Low = 5 points
This team can forecast the depth of their feature base for a fixed date (say the end of sprint 12). 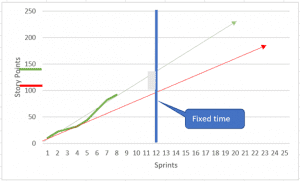 Their forecast would be that at minimum, they can accomplish 20 more points (5 points x 4 remaining sprints), and at most, 52 points (13 points x 4 remaining sprints). Using the above diagram, you can see the forecast would show they should be able to finish everything below the red line (112), some above the red line, but most likely none of the features above the green line (144). Even better, the team can describe the benefits and challenges of having and not having specific product features and capabilities according to priorities. If the team has a fixed scope, they can forecast a possible target date range.
 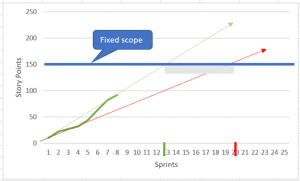 With the same backlog fixing the scope at 150 points, the earliest the team could accomplish their goal would be in ~5 more sprints (150 points – 92 points completed or 58 points remaining divided by 13 points) or as long as ~12 sprints (58 points divided by 5 points) Henrik affirms, in the video, “No lying! If your organization does not appreciate the truth, they will not like agile.” Enabling a product owner to forecast using actual data over a range from best case to worst case is the truth.
TIP
Regardless of the approach agile teams use to forecast the accomplishment of their goals, one fact remains the same. The better job the organization and leadership do at removing team impediments, the faster the team can reach their goals. Instead of asking, “What’s wrong with this team?” agile leaders serve the team by asking, ”How can I help?” Make enabling high performing teams your top priority.
Forecasts enable meaningful conversations
Agile forecasting can help give a team and organization confidence. However, what is more valuable is the opportunity it creates for a conversation about the facts exposed. Product owners have actual facts they can use to set realistic expectations with stakeholders. Development teams have true historical performance data based on their “definition of done” standards to help them set expectations with the product owner and with each other. The scrum master has historical facts to ask the tough questions of the team and organization. The facts enable teams to have conversations focused on individuals and interactions, working products, customer collaboration, and adapting to change, which is the essence of agility. Keep in mind that stable, persistent teams are more predictable. Disrupting teams by changing personnel or continually shifting their context leads to randomness, synonymous with chaos rather than predictability. The 2020 scrum guide reinforces this, “Selecting how much can be completed within a Sprint may be challenging. However, the more the Developers know about their past performance, their upcoming capacity, and their Definition of Done, the more confident they will be in their Sprint forecasts.” With product development fraught with uncertainty and complexity, only an empirical process control inherent in agile techniques will give you a realistic, fact-based forecast. The 2020 scrum guide says it best, “Various practices exist to forecast progress… While proven useful, these do not replace the importance of empiricism. In complex environments, what will happen is unknown. Only what has already happened may be used for forward-looking decision making.”
Need help with implementing empiricism?
We enable high-performing teams and organizations to use empiricism to create valuable products for customers.